


Would you be surprised to learn that there’s a lot of controversy around the measurement of poverty in the U.S.? How about that the way we measure it is based on the cost of food in the 1960s? At Shapiro+Raj, we spend a lot of time thinking about how to construct quantitative measurement tools. We know that HOW something gets measured will influence the actions taken as a result. So, it’s critical we craft metrics carefully to ensure they answer the right question and influence the right actions.
That’s why something like how we measure poverty in this country is inherently interesting to us. And given that having an accurate assessment of poverty is crucial for understanding the welfare of our society and for making informed policy decisions, let’s take a look at how poverty is measured in the United States.
The Official Poverty Measure (OPM)
The official measurement of poverty in the United States is called, surprisingly unsurprisingly, the Official Poverty Measure (OPM) and is derived by comparing household incomes to poverty thresholds. It was developed in the mid-1960s, went through some minor revisions in 1981, but has otherwise been untouched—despite discussions around the need for a more comprehensive measure going as far back as its own inception (source).
Income is asked retrospectively for the past year from a sample of U.S. households. The income total used in the OPM includes earnings and income from other sources like retirement income, child support, public assistance (cash, but excludes non-cash benefits), and trusts. Household income is compared to threshold values; a household income below the relevant threshold is considered in poverty. The poverty thresholds are based on the values developed in the early 1960s, where researchers established a basic standard of living as one that affords a subsistence “basket” of food for the family size. The thresholds start with the original 1963 values and are updated annually for consumer inflation. The thresholds are intended not as a definitive accounting of poverty in the U.S. so much as they are intended to provide a consistent and standard metric for tracking (source).
The Supplemental Poverty Measure (SPM)
Even if the OPM is intended only as a simple “yardstick” measure, there are still several shortcomings. The standard of living evolves, household basic needs change, cost of living varies by geography—the list goes on. The Census Bureau attempted to address this in 2011 with their release of the Supplemental Poverty Measure (SPM), which uses a more detailed approach for measuring poverty. The SPM uses an estimate of the cost of a basket of basic needs, and includes not only cash benefits, but also noncash benefits like housing subsidies and SNAP, in the income calculation. The Census Bureau now reports out both measures in their annual report on poverty.
Limitations of the OPM and SPM
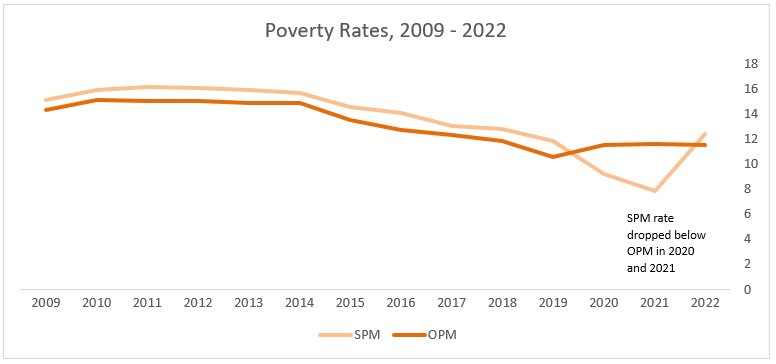
Given the way that the OPM and SPM are calculated, the SPM typically shows higher rates of poverty overall than the OPM (except for 2020 and 2021). Because the SPM incorporates benefits, this sharp decrease in poverty as measured by the SPM is likely due to the various additional benefits and assistance programs rolled out to support people through the unsteady COVID pandemic economy. But a question stands—we see that the two measures have the potential to substantially disagree. In that case, should we prefer one measure over the other?
We can see that a more complex measure like the SPM may be more labile, with large changes to benefit programs more likely to cause a swing. Additionally, many of the benefits included in the SPM are accounted for on the income side of the equation but are not accounted for in the threshold calculations (expenditures). And both measures rely on retrospective data about income and/or spend, which researchers have called into question (for example, here and here). The OPM, of course, does not capture people who are lifted out of living in poverty due to benefit programs as well as the SPM does. And concerningly, the research undergirding the OPM is 60 years old and the OPM correspondingly shows potentially eyebrow-raising behavior relative to income.
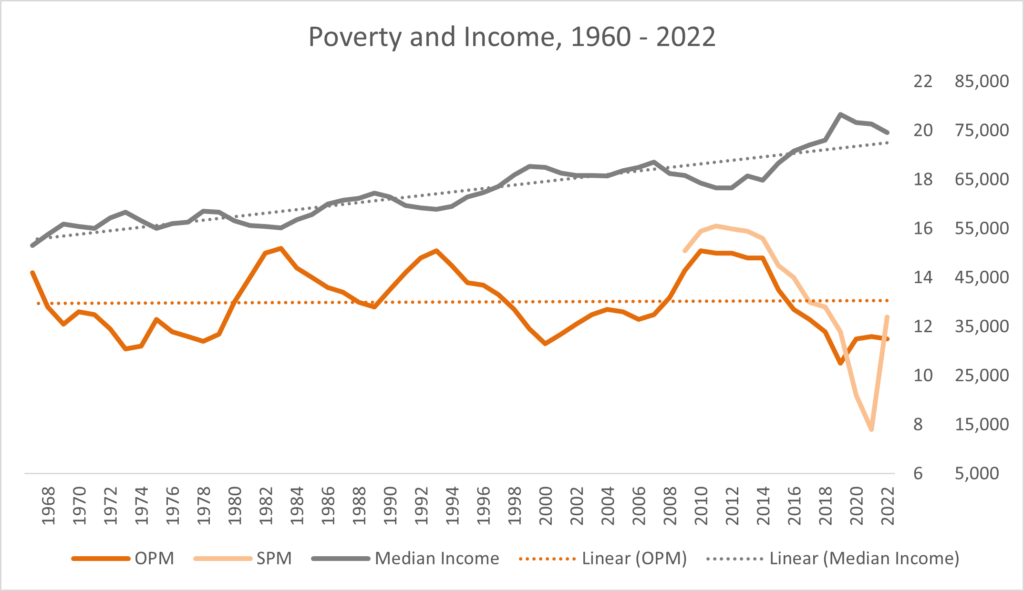
In the figure below, we see that fluctuation in inflation-adjusted median income since the 1960s coincides with fluctuation in OPM poverty rates—the cross-correlation function indicates that these series cross-correlate with 0 lag. Median income significantly predicts OPM poverty (p = 0.01). However, we see a positive linear trend in inflation-adjusted median income (p < 0.01), while OPM poverty rates show no corresponding trend (p = 0.82). In other words, OPM poverty shows the same general shocks to the system as income, but it doesn’t show a general trend that corresponds with the general increasing trend in income. This lack of corresponding trend raises questions. Why does OPM remain relatively stable (outside of the shocks) when much of the broader conversation on poverty and income inequality might tell us otherwise. This may be another indication that we should revisit if this metric is still performing as intended.
Suggestions for Improvement
With all of this in mind, it would not be advisable to rely on either measure alone as they currently stand. Yet, there is a case for a paradigm where two measures are “the” official measurement. This is a case where we need two distinct metrics to track two distinct questions. We do want to a general accounting of the households who simply do not have enough income to meet a basic standard of living. But we also want to track an accounting of the rate of people who not only don’t have enough income, but for whom subsidies and benefits are insufficient to bring them up to a basic standard of living. The first measure would track larger trends in financial wellbeing, while the latter measure would be a more reactive measure that tracks the effectiveness (or lack thereof) of government policies in this area.
The first measure looks like the OPM, but with some updates and investigations:
- A re-evaluation of what comprises a subsistence basket of food.
- Updated research on the proportion of income that food represents.
- Geographic variation evaluated for both of the points above.
- Determine the effect of asking income in nearer term, like past 3 months.
- Income evaluated as post-tax, in line with threshold calculation, instead of pre-tax.
- A plan for a re-evaluation approach and schedule, so that the measure remains validated and up to date.
The second measure would be a modified, somewhat simplified SPM.
- Determine the effect of asking income in nearer term, like past 3 months.
- Develop standards for accommodating noncash benefits in expenditures.
- Simplify housing type adjustments.
I’ll be honest here—given the near lifetime between the rollout of the OPM and the rollout of the SPM, I’m not entirely optimistic about the odds of any big changes resulting from this little overview. But having an accurate assessment of poverty is an issue that affects us all, as it impacts policy, government spending, and people we know. If we pay attention to, publicly agitate for, and support efforts to improve our official measurement of poverty, maybe we won’t have to wait another near lifetime before the next improvement.
The conversation about how to improve poverty measurement is not without controversy; what do you think are the most important elements to improve upon?
As you can see, we love thinking about crafting the right quantitative metrics to measure the right business goals. If this spurred some thinking about your quantitative or tracking metrics, we would love to chat. Reach out at communications@shapiroraj.com.
About Shapiro+Raj
Shapiro+Raj, the sixth-largest independent insights company in North America, generates Future-Forward Insights for Fortune 500 clients. Recognized as the top-5 most innovative research company, the #1 strategic insights consultancy, and the largest Nationally Certified Minority Business Enterprise, Shapiro+Raj operates from Chicago, New York, and Pune, India, serving global clients. For more information, contact Shapiro+Raj at (312) 965-2319 or visit https://www.shapiroraj.com.